Task 1 vocabulary isn't one long list. It's a set of small toolkits, and the visual tells you which one to open. The table below matches each visual to its words and tense.
The small words matter more than rare ones. In 9,533 Task 1 answers scored by the GoPrep AI examiner (28 July to 26 September 2026), 1 in 3 got a subject-verb agreement fix and 1 in 4 a preposition fix.
Which words for which visual
Ask two questions first: what does the visual show, and what period does it cover? The first picks your words, the second your tense. Officially, Academic Task 1 can show one or more graphs, charts or tables, or a diagram of an object, device, process or event.
| Visual | Words you need | Tense |
|---|---|---|
| Line graph | Trends, to / by / from, approximations | Past simple for past years, is expected to for projections |
| Bar chart | Comparisons; change words only if it shows change over time | Present simple with no dates, past simple with past years |
| Pie chart | Proportions and fractions | Same as a bar chart |
| Table | Comparisons, signposting; change words only if it shows change over time | Same as a bar chart |
| Process | Sequencers, the passive for actions done to things | Present simple |
| Map | Change verbs, location words | Past simple for past changes, future forms for plans |
| Mixed | The toolkits of both, linked with Turning to the table, ... | Each visual's own period |
Change verbs need change over time: the same measure at different moments, in years, months or hours. On a chart of five countries in one year, Japan rose states a change that isn't there. Write Japan has the highest figure.
How to start: the introduction and overview
The introduction paraphrases the task (says it in other words). The overview briefly names the main features; detailed figures usually belong in the body paragraphs. Here is a task from the GoPrep Writing course:
The table below shows the percentage of households in one country that owned a car, a computer and a smartphone in 2005 and 2020.
| In the task | Your paraphrase | What must stay |
|---|---|---|
| The table below shows | The table compares | The type of visual |
| the percentage of households | the proportion of households | The unit: households, not people |
| that owned a car, a computer and a smartphone | owning a car, a computer and a smartphone | Every category |
| in 2005 and 2020 | in 2005 and 2020 | The years |
The table compares the proportion of households in one country owning a car, a computer and a smartphone in 2005 and 2020. Overall, ownership of all three items rose, and smartphones went from the least common item to the most common.
You can open the overview with Overall,. Name the biggest change or the highest and lowest category, and keep detailed figures for the body paragraphs. One example for each chart type is in how to write a Task 1 overview. How often first answers had no summary words at all, by visual:
| Task 1 type (students) | Under 150 words | No summary words | Average first band |
|---|---|---|---|
| Pie chart (1,186) | 37% | 26% | 5.5 |
| Line graph (1,453) | 35% | 20% | 5.5 |
| Process (537) | 32% | 19% | 6.0 |
| Table (239) | 26% | 8% | 6.0 |
| Bar chart (417) | 24% | 11% | 6.0 |
| Mixed charts (566) | 23% | 16% | 6.0 |
| Map (371) | 18% | 11% | 6.0 |
Trends: words for change over time
Use these when the visual shows change over time, including a bar chart or table with the same measure at several dates. The core pattern is a trend verb plus an adverb of size or speed: rose sharply, fell slightly. The line graph guide builds a whole report around them.
| Movement | Verb pattern | Noun pattern |
|---|---|---|
| Up | rose sharply, increased steadily, climbed, grew | a sharp rise in, a steady increase in |
| Down | fell dramatically, declined gradually, dropped, decreased | a dramatic fall in, a gradual decline in |
| Highest point | peaked at, reached a peak of | a peak of |
| Lowest point | fell to a low of, bottomed out at | a low of |
| Stayed level | remained stable at, stayed at, held steady at | a period of stability |
| Stopped rising or falling | levelled off at, plateaued at | a plateau |
| Repeated ups and downs | fluctuated between ... and ... | fluctuations in |
| Size of the change | big: sharply, dramatically, significantly; even: steadily; bit by bit: gradually; small: slightly, marginally | sharp, dramatic, significant, steady, gradual, slight, marginal |
Switch patterns to show range: Exports rose sharply → There was a sharp rise in exports.
Level off follows a change (After rising, the figure levelled off at 40%); remain stable fits a line that was flat all along. Fluctuate means repeated rises and falls, not one peak.
Prepositions for numbers: to, by, from, at, of
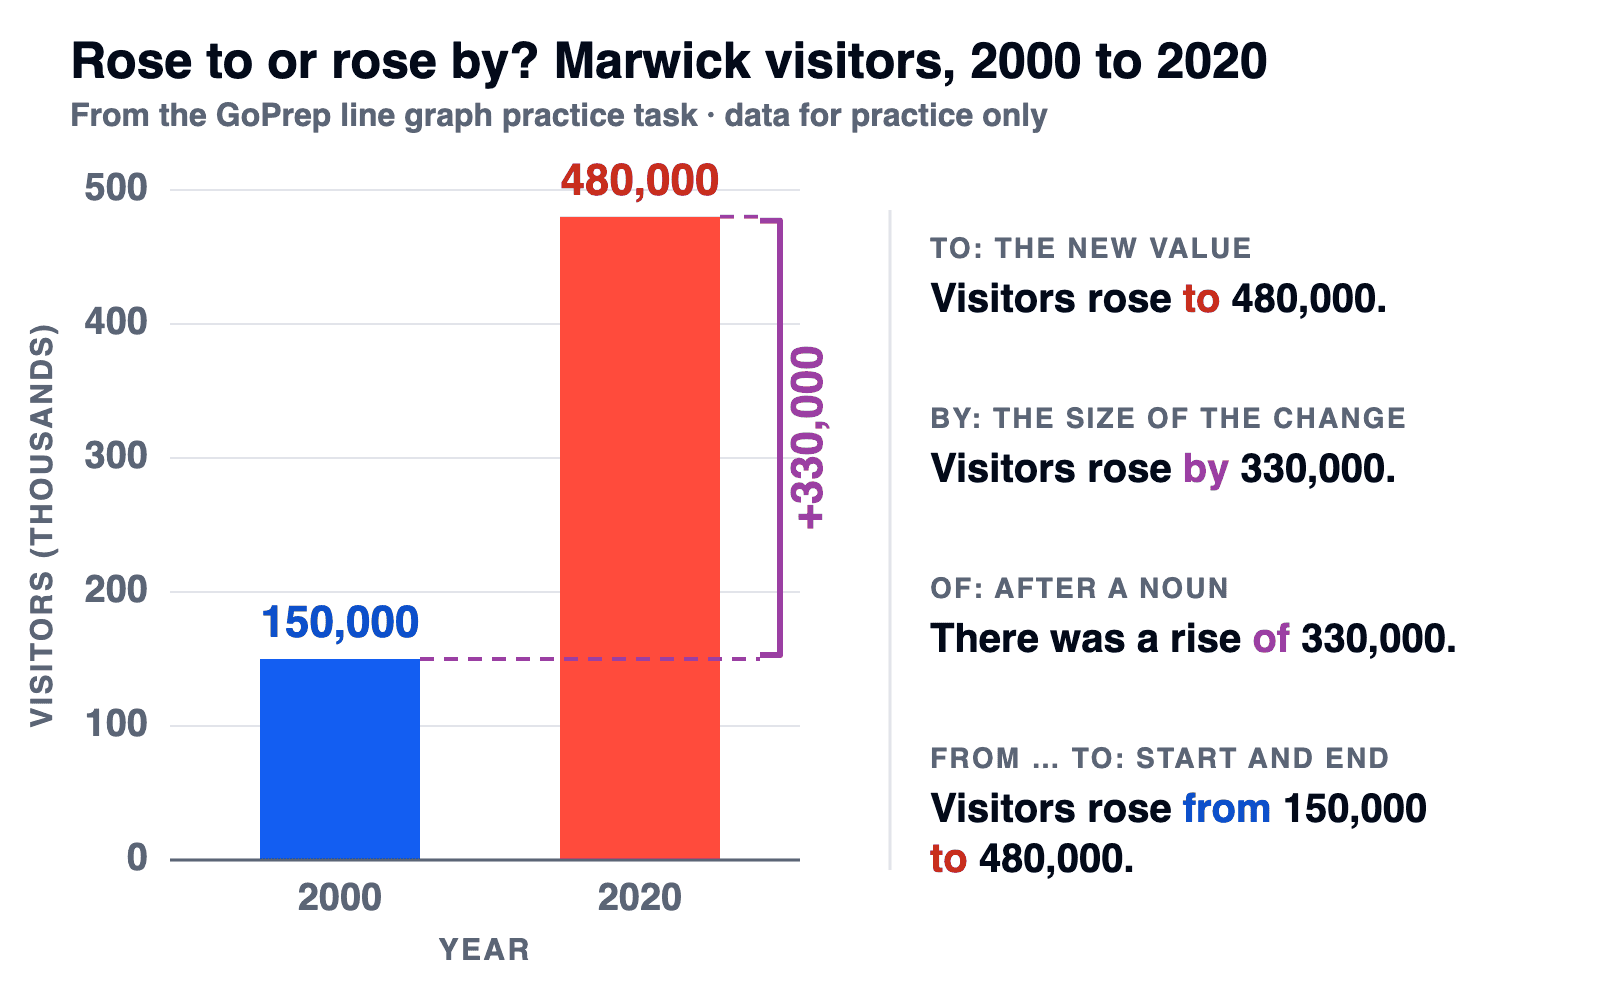
Most number sentences hang on one small word. To gives the new value, by gives the size of the change. Mix them up and you state a different fact: rose to 330,000 and rose by 330,000 describe two different graphs.
| Preposition | Use it for | Example |
|---|---|---|
| to | The new value | Visitors rose to 480,000. |
| by | The size of the change | Visitors rose by 330,000. |
| from ... to | Start and end values | Visitors rose from 150,000 to 480,000. |
| at | A level where something peaks, stands or stays | peaked at 90%, stood at 40%, remained stable at 20% |
| of | The amount, after a noun | a rise of 330,000, a peak of 90% |
| in | What changed, after a noun; also years | a rise in visitors, in 2010 |
| between ... and, over | A period | between 2000 and 2020, over the period |
Three more number traps:
- No preposition after reach: reached to 80% → reached 80%.
- By + a year means "no later than": By 2020, visitors had reached 480,000. The past perfect stresses that the change was complete, but the past simple is correct too.
- Percentages change in percentage points: a rise from 10% to 85% is a rise of 75 percentage points. A 75% rise would mean it grew by three quarters of itself.
Approximations: about, just over, almost
When a value sits between gridlines, an honest approximation beats a made-up exact number. Check each number against the visual once before you finish.
| Where the value is | Phrases | Example |
|---|---|---|
| Close to it | about, around, roughly, approximately | around 480,000 |
| A little above | just over, slightly more than | just over 40% |
| A little below | just under, almost, nearly | almost half |
| A multiple | doubled, tripled, more than doubled, almost halved | Visitors more than tripled. |
Comparisons: bar charts and tables
Name the highest and the lowest, then put a size on the gaps. The bar chart guide and the table guide show how to group the categories. Most examples use one chart: under-30s and over-50s in four leisure activities. The last row uses the household figures.
| Job | Phrases | Example |
|---|---|---|
| Bigger or smaller | higher than, exceeds, outstrips, trails | Among the under-30s, social media (80%) outstrips the cinema (55%). |
| Size of the gap | twice as high as, three times the figure for, nearly double | Social media attracts 80% of the under-30s, more than three times the figure for the over-50s. |
| Extremes | the highest, the lowest, the most popular, the least common | Gardening is the most popular activity among the over-50s. |
| Contrast | while, whereas, compared with, by contrast | Gardening attracts 70% of the over-50s, whereas only 15% of the under-30s take part. |
| Gap changing over time | the gap widened, the gap narrowed, the figures converged | The gap between car and computer ownership narrowed from 33 to 12 percentage points. |
Three grammar notes:
- One comparative at a time: more higher → higher.
- Compare like with like: The figure for Japan was higher than that for Korea (those for with plurals).
- Number or amount: the number of cars for things you can count, the amount of water for things you can't.
Proportions: pie charts and percentages
A pie chart shows shares of one whole, so name the share in words and add the figure in brackets if needed: Cars made up just under half of all journeys (48%). The pie chart guide shows how to follow one slice across two charts.
| Share | Phrase |
|---|---|
| More than 50% | the majority of, most of, more than half of |
| About 50% | about half, just over half, just under half |
| About 33% | a third, roughly a third |
| 25% | a quarter |
| 20% | a fifth |
| 10% | a tenth |
| Under 5% | a small fraction, a tiny proportion |
Link the slice to the whole with accounted for (not accounted 25%), made up or represented. The proportion of and the percentage of take a singular verb: The proportion of students who cycle is small.
Stages: process diagrams
Describe the stages and actions in order, and include any figures the diagram gives, such as times or temperatures. The process diagram guide walks through a full example.
| Job | Phrases |
|---|---|
| Start | First, To begin with, The process begins with |
| Middle | Next, After that, Subsequently, Following this |
| One stage triggers the next | Once ..., As soon as ..., After the beans have been roasted, ... |
| End | Finally, In the final stage, The process ends with |
| Refer back | it, this mixture, the resulting paste, these granules |
Use the present simple. For actions done to things, the passive is common: the beans are roasted. When something acts by itself, use the active: the mixture cools, water evaporates. After once, the present perfect is fine.
Changes on a map
Most map tasks compare one place at two points in time: say what changed, what stayed and where. For a single map, location words do most of the work. The map guide shows how to order the changes by area.
| Change | Phrases |
|---|---|
| Something new | was built, was constructed, was added, was opened |
| Something gone | was demolished, was knocked down, was removed, was cleared |
| One thing became another | was replaced by, was converted into, was turned into |
| Something got bigger | was expanded, was extended, was widened |
| Moved or joined | was relocated, was connected to |
| No change | remained unchanged, was retained |
| Location | in the north-west, to the east of, next to, opposite, along the river |
Past changes take the past simple. Use the passive for actions done to things (the forest was cleared) and an active verb to describe position (the road ran along the river). Plans take future forms: the car park will be replaced by a park.
The grammar slips that cost marks
After scoring an answer, GoPrep's AI examiner gives a Band Contract: three priority fixes for that answer. In Task 1, many common fixes are about the grammar around ordinary words. The tables show the categories this guide covers, not a full ranking of errors:
| Slip | How often | What to check |
|---|---|---|
| Subject-verb agreement | 33% | The number of visitors were → was. But a number of visitors (several) takes were. |
| Prepositions | 26% | increased on 20% → by 20%; peaked in 90% → at 90%; a rise of exports → in exports |
| Comparisons | 19% | more higher → higher; than that for Korea |
| Articles | 18% | There was sharp rise → a sharp rise; the USA, the UK, but Japan |
| Word form | 15% | a sharply increase → a sharp increase; the percent of → the percentage of |
| Tense | 11% | Past years: past simple; no dates: present simple |
The mix changes with the visual. Check these first for your task type:
| Visual | Selected common fixes | Check first |
|---|---|---|
| Line graph | agreement 29%, prepositions 28% | to / by, the number of ... was |
| Bar chart | agreement 28%, prepositions 24%, comparisons 23% | one comparative, than |
| Pie chart | agreement 37%, comparisons 28% | the proportion of ... is |
| Table | agreement 31%, prepositions 25%, articles 24% | the, in, at |
| Process | agreement 35%, linking 34%, passive 33% | is / are + past participle; linkers by meaning |
| Map | prepositions 39%, agreement 38%, articles 33% | in the north, to the east of |
| Mixed | agreement 38%, comparisons 28% | each visual's own words |
Worked example: one paragraph, five toolkits
Here is the household task from the introduction section as a body paragraph.
| Item | 2005 | 2020 |
|---|---|---|
| Car | 78% | 82% |
| Computer | 45% | 70% |
| Smartphone | 10% | 85% |
Weak body paragraph
The number of household which own smartphone increase on 75% and computer also rise to 25%. Car was most popular in 2005 and it rised slightly.
The first slip is factual: the table shows the percentage of households, not their number, so write the percentage of households or smartphone ownership. Then the language:
- agreement (number ... increase)
- a preposition (on 75%), and 75% should be 75 percentage points
- a to/by mix-up (rise to 25%: it rose by 25 points, to 70%)
- a missing article (the most popular)
- rised instead of rose
Household, smartphone and computer should also be plural, and the verbs need the past simple.
Strong body paragraph
Smartphone ownership saw the sharpest change, climbing from just 10% of households in 2005 to 85% in 2020, a rise of 75 percentage points. Computer ownership also rose substantially, from 45% to 70%. Car ownership, by contrast, was already high at 78% and edged up only slightly, to 82%, so cars were the most widely owned item in 2005 but had been overtaken by smartphones by 2020.
Why it works: trend verbs with size words, a rise of, from ... to, superlatives and by contrast. Most verbs are in the past simple; had been overtaken ... by 2020 is past perfect passive and stresses that the change was complete by 2020. The past simple would also be correct.
Practice: three other kinds of visual
Try the other toolkits on three short tasks. Write two sentences for each before you read the model. The data is invented for practice.
1. A bar chart with no dates
The percentage of secondary school students who study a second foreign language, in four countries, in one survey year.
| Country | Students |
|---|---|
| Finland | 72% |
| Spain | 45% |
| Canada | 30% |
| Japan | 18% |
Finland has by far the highest proportion of students learning a second foreign language, at 72%, four times the figure for Japan (18%). Spain and Canada fall in between, at 45% and 30% respectively.
One moment in time: present simple, no rose, and a size for the gap.
2. A process
How apple juice is made, in five stages.
| Stage | What happens |
|---|---|
| 1 | Apples are picked and washed |
| 2 | Apples are crushed into a pulp |
| 3 | Juice is pressed out of the pulp |
| 4 | Juice is heated to 70°C |
| 5 | Juice is poured into bottles and cools |
First, the apples are picked and washed, after which they are crushed into a pulp. Once the juice has been pressed out, it is heated to 70°C. Finally, it is poured into bottles, where it cools.
The passive for actions done to the apples, the active for cools, once to link stages, and the temperature kept.
3. A map
A riverside town in 1995 and 2025.
| Area | 1995 | 2025 |
|---|---|---|
| North of the river | Farmland | Housing estate |
| Riverside | Factory | Park |
| Across the river | No bridge | Footbridge |
| Town centre | Railway station | Railway station |
Between 1995 and 2025, the farmland north of the river was replaced by a housing estate, and the riverside factory was converted into a park. A footbridge was built across the river, while the railway station in the town centre remained unchanged.
The past passive for things done to places, a location in each clause, and one feature that stayed the same.
FAQ
What vocabulary do I need for IELTS Writing Task 1?
It depends on the visual: trend words for change over time, comparisons for categories, proportions for pie charts, sequencers for processes, change and location words for maps. You also need the prepositions that attach numbers: to, by, from, at and of.
How do I start Task 1 and write the overview?
Paraphrase the task in one sentence, keeping the units, categories and years as given. Then write the overview, which can start with "Overall,": briefly name the main features, such as the biggest change, and keep detailed figures for the body paragraphs.
Is it "increase by" or "increase to"?
Both, with different meanings. Use "to" for the new value (rose to 480,000) and "by" for the size of the change (rose by 330,000). After a noun, use "of": a rise of 330,000.
How much does vocabulary count in Task 1?
Lexical Resource is one of four equally weighted criteria, so it makes up a quarter of your Task 1 score. Task 2 carries more weight than Task 1 in the Writing band.
Do I need advanced vocabulary for band 7 in Task 1?
You need some less common words, used accurately. The official band 7 descriptor asks for some ability to use less common items and awareness of collocation, with only a few errors in word formation.
Where to practise next
The line graph guide has a full practice task and a model answer. Task 2 needs words for arguing rather than describing data: see Task 2 vocabulary by meaning. To see which part of the test to work on first, take the quiz: tell GoPrep your target score and exam date, and get a study plan built around them.

GoPrep Team
GoPrep guide authors
We write about IELTS preparation using platform data and official exam materials.
All articles by GoPrep Team